Geometric way of thinking: the aim is to interpret dynamics of differential equations without fully solving them! \[ \dot{x}_1 = f_1(x_1, \ldots, x_n) \cdots \dot{x}_n = f_n(x_1, \ldots, x_n) \] Instead, we interpret them as vector fields by looking at flows & trajectories
To measure the fractal dimension of a surface by the direct procedure described above is difficult, and so it is convenient to adopt alternative procedures based on sections with lower-dimensional subspaces
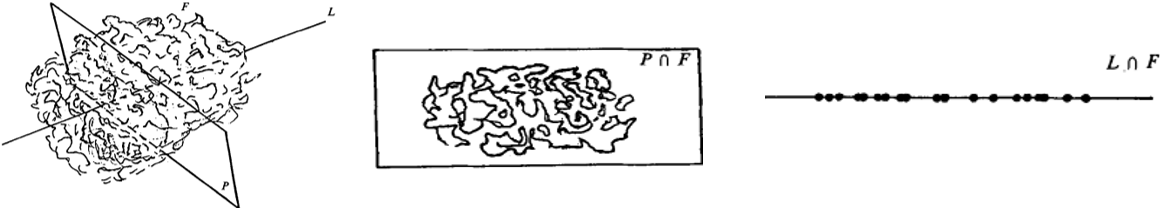
A schematic of an object \( F \) with a fractal interface, and its intersections with a plane and a line
Fractal geometry methods have been used to analyze various turbulent flow data. Due to the chaotic nature of turbulence, fractal geometry offers a method of analysis which is natural to spatial and time series data.
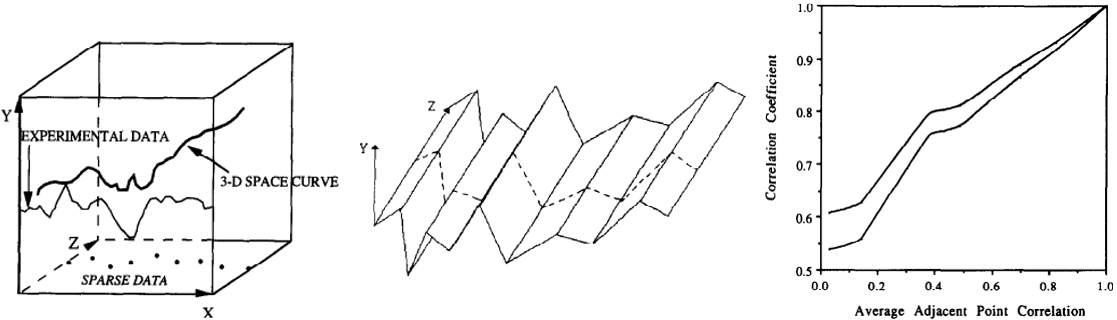
The figures above illustrate, for turbulent flow data, the interpolation of sparse experimental data into a 3-D space curve, the extension of the \( Y\text{–}X \) plane curve into a three-dimensional surface, and the evaluation of interpolation accuracy using the 95% confidence interval of correlation coefficient between the interpolated data and actual \( Z\text{–}X \) plane data
1Sreenivasan KR, Meneveau C. The fractal facets of turbulence. Journal of Fluid Mechanics. 1986;173:357-386. doi:10.1017/S0022112086001209
2M.A. Marvasti, W.C. Strahle. Fractal Geometry Analysis of Turbulent Data: IEEE Signal Processing Magazine. Vol. 41 (1995), pp. 191-201