\[ \dot{x} = \sin x \]
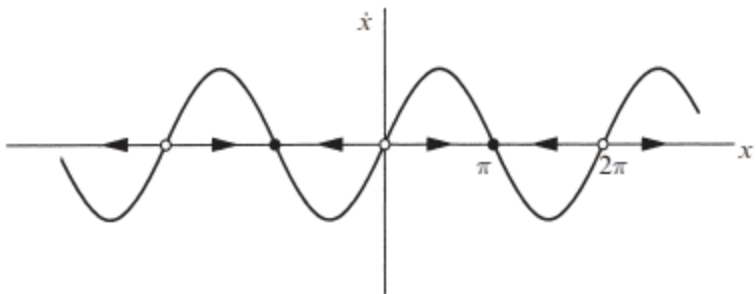
A particle starting at \(x_0 = \pi/4\) moves to the right faster and faster until it crosses \(x = \pi/2\) (where \(\sin x\) reaches its maximum). Then the particle starts slowing down and eventually approaches the stable fixed point \(x = \pi\) from the left
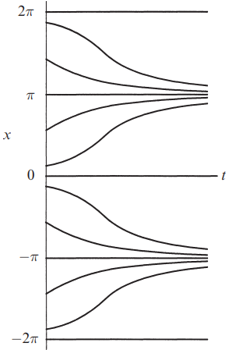
The curve is concave up at first, and then concave down; this corresponds to the initial acceleration for \(x < \pi/2\), followed by the deceleration toward \(x = \pi\)
A picture can’t tell us certain quantitative things: for instance, we don’t know the time at which the speed \(|\dot{x}|\) is greatest. But in many cases qualitative information is what we care about
1Strogatz, S.H. (2015). Nonlinear Dynamics and Chaos: With Applications to Physics, Biology, Chemistry, and Engineering (2nd ed.). CRC Press.