Problem 2: Expanded Knowledge
A
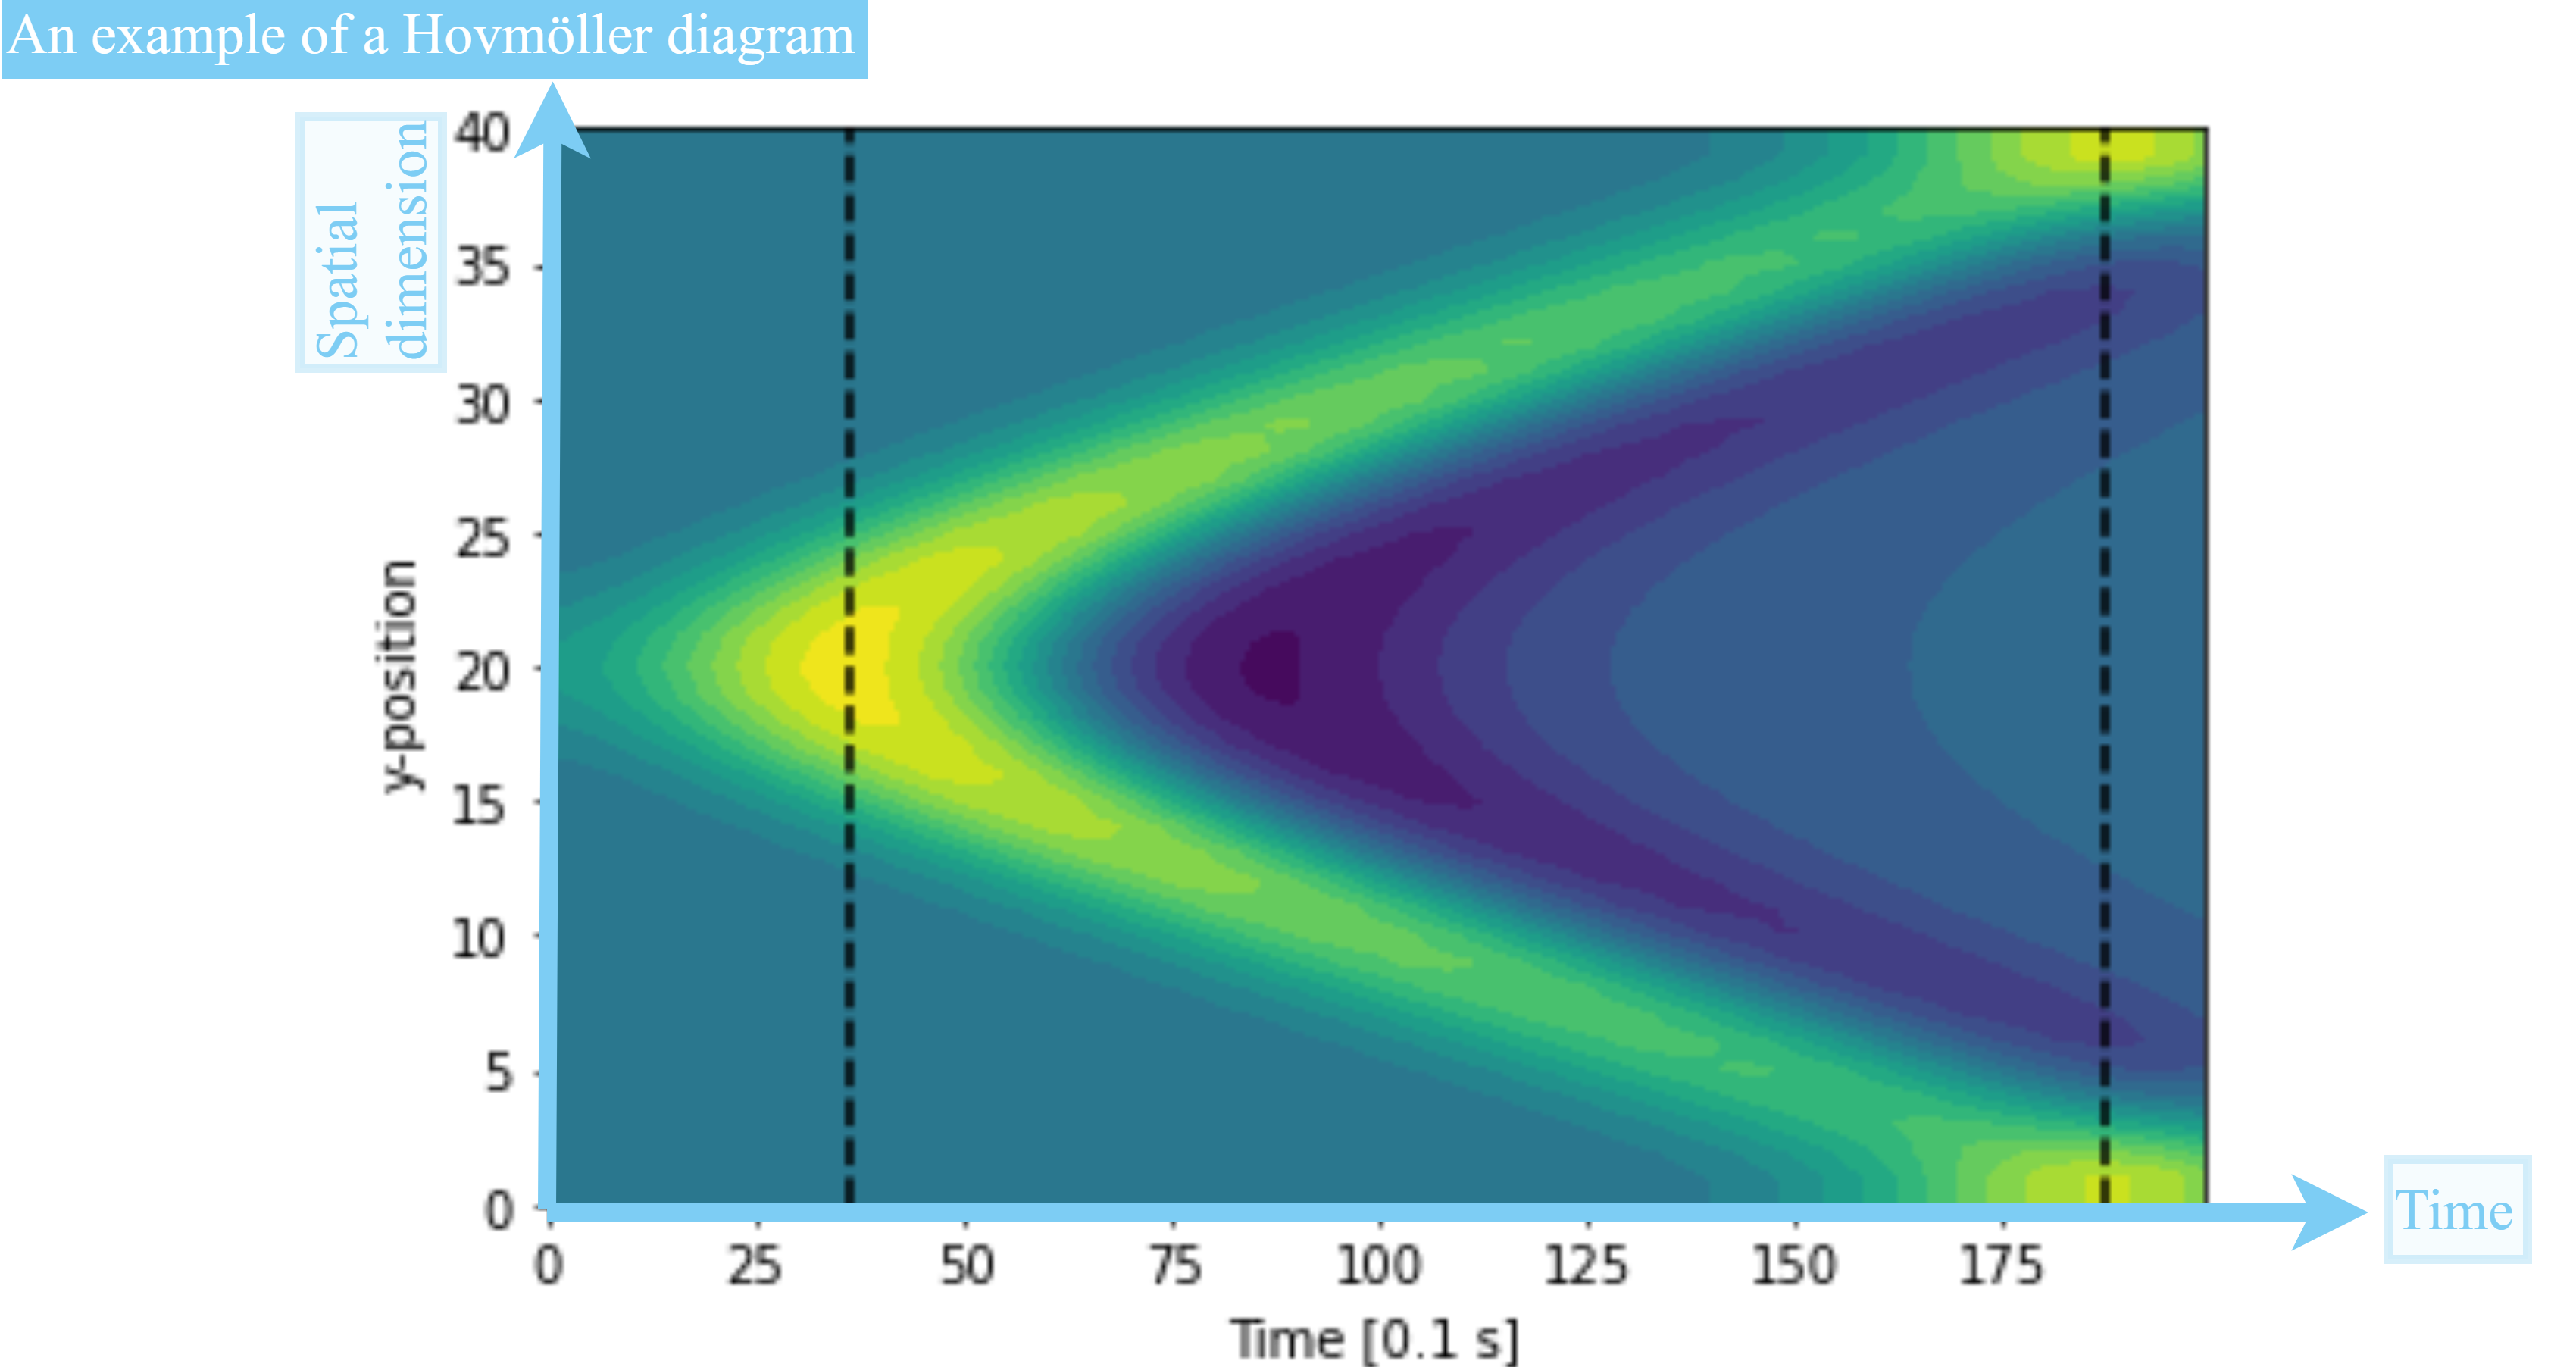
Hovmöller diagram
is a type of plot widely used in meteorology and geophysics. It is typically a 2D plot where a scalar value such as temperature or sea elevation is plotted along one spatial dimension (\(x\), \(y\) or \(z\)) against time
◀
▶