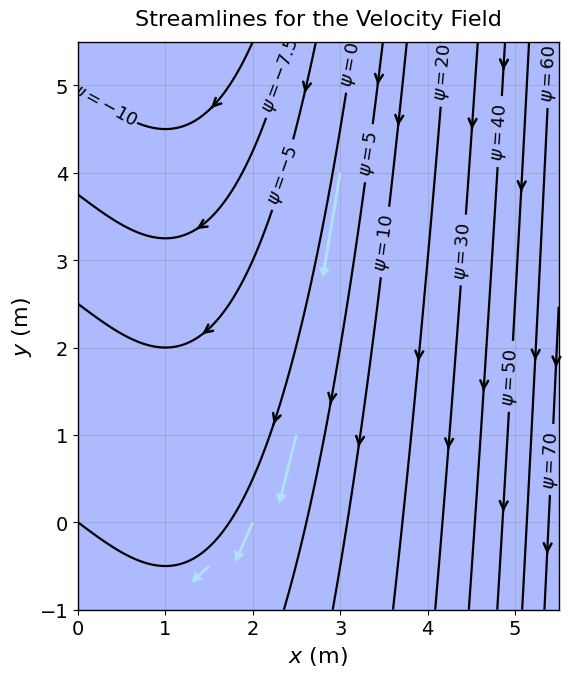
Example: Calculation of the Velocity Field from the Stream Function
Axes and Display
ax.set_xlim(0, 5.5)
ax.set_ylim(-1, 5.5)
ax.set_aspect('equal', adjustable='box')

ax.set_xlabel(r'$x,\ \mathrm{m}$')
ax.set_ylabel(r'$y,\ \mathrm{m}$')

ax.grid(True, alpha=0.35)
ax.set_title('Streamlines for the Velocity Field')

plt.tight_layout()
plt.show()